Demographic Trends Shaping Game Type Preferences Across State-Regulated Mobile Platforms
Written by Ellis Wagner · Aug 12, 2026
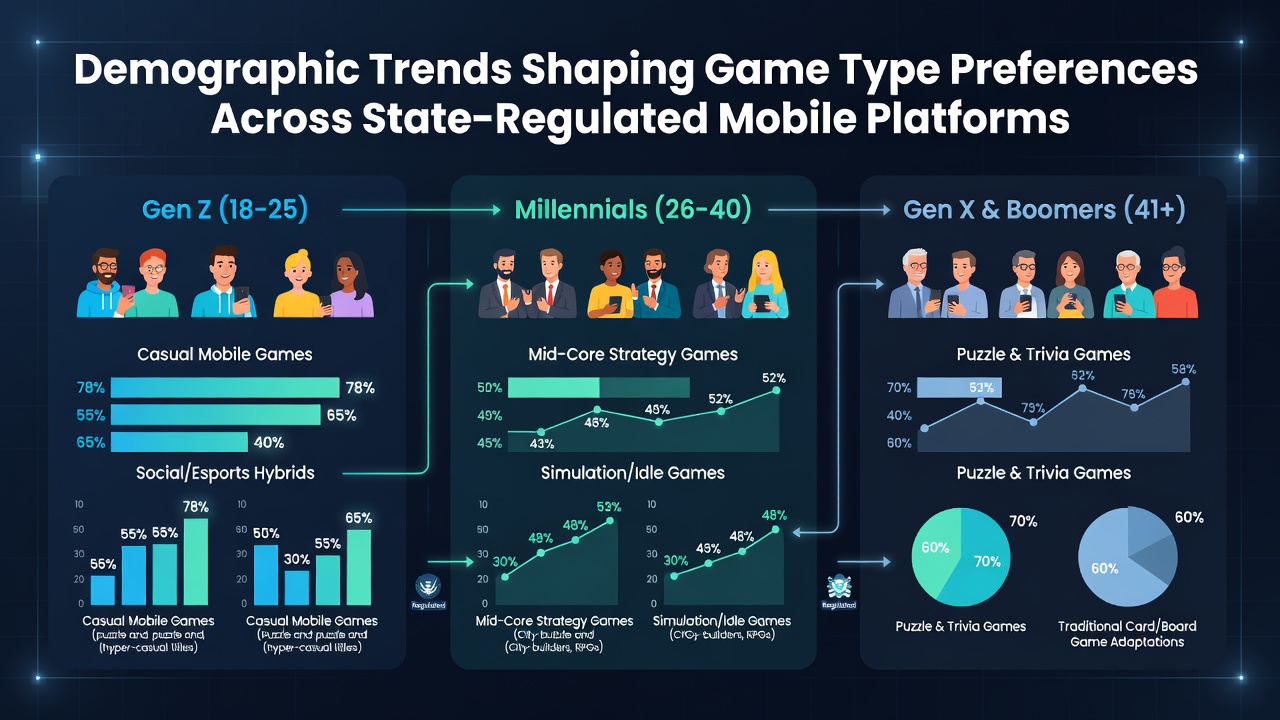
Demographic Trends Shaping Game Type Preferences Across State-Regulated Mobile Platforms
State-regulated mobile platforms continue to reflect shifting demographic patterns that influence which game types gain traction among different user groups, and data from multiple jurisdictions show consistent correlations between age, location, and preferred formats. Analysts tracking activity in August 2026 note that these patterns emerge from licensing rules, device access rates, and population distributions rather than random variation.
Age Groups and Format Selection
Users aged 21 to 34 demonstrate higher engagement with live dealer table games on mobile apps, while those over 55 show stronger retention in slot-based offerings across states that permit both categories. Reports compiled by the Nevada Gaming Control Board indicate that younger cohorts complete more sessions per week in interactive table environments, whereas older players log longer individual play times in automated reel games. These differences align with varying comfort levels around real-time social interaction and screen navigation demands.
Researchers at institutions studying digital wagering have observed that skill-influenced titles attract participants in the 25-to-40 range at elevated rates, particularly in markets where state compacts allow hybrid poker or blackjack variants. Meanwhile, straightforward video slots maintain broader appeal among users who entered regulated mobile markets after 2020.
Geographic and Regulatory Influences
State-specific rules create measurable differences in game availability that intersect with local demographics. In Pennsylvania and New Jersey, where online table options expanded earlier, urban populations show elevated participation in live dealer formats compared with rural users who favor slots. Data from the New Jersey Division of Gaming Enforcement reveal that county-level adoption rates track closely with broadband penetration and median age figures.
Similar patterns appear in other regions. Observers note that Midwestern states with newer mobile frameworks record slower uptake of complex table games among older demographics, while coastal markets with established player bases display steadier cross-category engagement. These variations stem directly from when each jurisdiction authorized mobile access and how licensing conditions shaped interface designs.
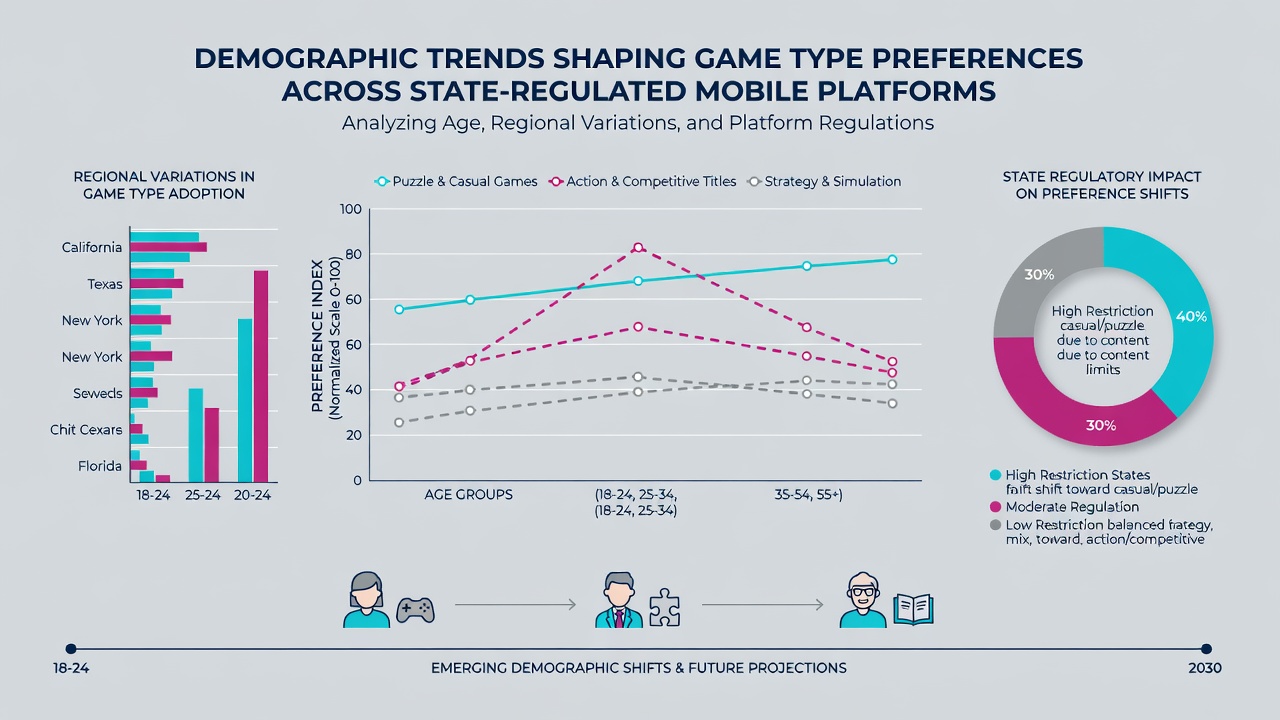
Income Levels and Session Behaviors
Household income data correlate with volatility preferences in several regulated markets. Higher-income users participate more frequently in progressive jackpot slots and high-limit table rooms, according to aggregated figures released by state oversight bodies. Lower-to-middle income groups concentrate activity in lower-stakes instant-win and casual slot titles that permit shorter, more frequent sessions without large initial commitments.
Payment method choices further illustrate these divides. Users in upper income brackets adopt digital wallet options at higher rates for seamless table game entries, while broader populations rely on traditional card processing that aligns with simpler game flows. These patterns hold steady across platforms operating under uniform state standards.
Gender Distributions in Game Categories
Platform analytics indicate that female users represent a growing share of slot activity in states such as Michigan and West Virginia, whereas male users maintain higher representation in live dealer and sports-adjacent table products. Industry reports from the Canadian Gaming Association document parallel trends in provinces with comparable mobile regulations, suggesting demographic drivers operate beyond single-country boundaries.
Time-of-day data add another layer. Female players in tracked cohorts show increased evening participation in themed slot content, while male engagement spreads more evenly across table and slot options during daytime hours. These observations derive from anonymized session logs rather than self-reported surveys.
Device and Interface Factors
Smartphone model distributions intersect with demographic groups and influence game type uptake. Newer devices with advanced graphics processing see heavier use among younger urban users who gravitate toward visually intensive live dealer streams. Older device owners, often in different age brackets, exhibit stronger preferences for lighter slot interfaces that load quickly on varied network conditions.
State regulators have documented that accessibility features such as simplified navigation menus correlate with broader retention among users over 50, regardless of game category. These technical considerations shape how demographic trends manifest in actual play patterns on regulated apps.
Conclusion
Demographic trends continue to shape game type preferences through measurable intersections of age, geography, income, and device access within state-regulated mobile environments. Data collected through August 2026 underscore that these patterns arise from licensing frameworks and population characteristics rather than isolated platform decisions. Continued monitoring across jurisdictions will clarify how evolving regulations interact with shifting user bases over time.